إرسال رابط إلى التطبيق
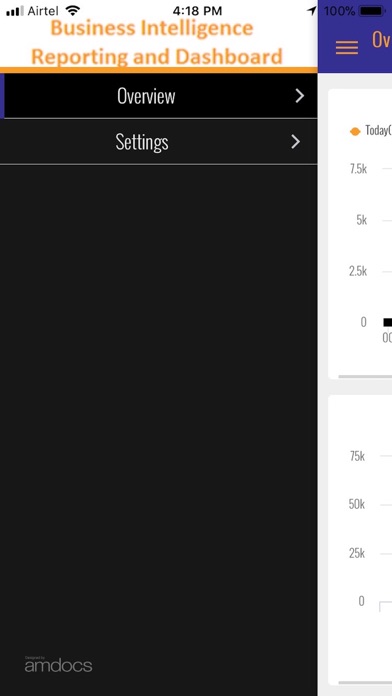
Business intelligence reporting dashboard for representing the business KPIs in graphical format to make easier data analysis and comparison.
Representing data on the daily, hourly basis which will give current status of important KPIs so user can take action on that as per requirement.
Added new key activities like Restore,Resume,Deactivations,Suspend. where user can see daily count if these key activities and can take action accordingly.
Now user can see history details related to Billing and payments.Provided auto-login functionility with UI enhancement.


